Instruments to which this note applies: I-Cal Flex
Prepared by: Lars Wadsö
Target use: ecology, insect metabolism, small animal activity, standard metabolic rate
Introduction
동물의 표준 대사율 (SMR)은 가장 낮은 대사율이고 이 대사율은 휴식시의 대사율입니다. 이는 기본 대사 속도 (BMR)와 동일하지만 BMR은 일반적으로 대사 열에 의해 일정한 체온을 유지하는 흡열 유기체에 사용되는 반면, SMR은 변온 동물에 사용되는 용어로 체온이 주변 온도에 따라 달라집니다. BMR은 열 중립상태에서 측정해야하지만 SMR은 어느 온도에서든 측정가능합니다.
SMR은 일반적으로 화력 (W), 비열 (W/g) 혹은 산소 소비율과 같이 다양한 방식으로 보고 될 수 있습니다. 화력 (열 발생량)에 기초한 SMR은 등온 열량 측정법에의해 가장 적합하게 측정됩니다.
SMR을 측정하려면 몇 가지 기준을 충족해야합니다:
- 측정 온도를 명시해야합니다.
- 동물이 쉬는 동안 측정해야합니다.
- 동물의 상태가 양호해야합니다.
- 동물은 최근에 먹이를 먹지 말아야합니다.
SMRs are of interest for many reasons. One is that they are fundamental to theories of allometric relationships, i.e., how animal size and activity relate. The most famous of these relationships is Kleiber’s law for endothermic animals, but there are also more recent and more general such models, for example Metabolic Theory of Ecology [1].
This application note concerns measurements of SMR on insects. As insects are primarily aerobic [2] and the enthalpy of respiration (kJ/moloxygen) is independent of the type of substrate [3], calorimetric measurements of heat production rate of insects are equivalent to oxygen consumption measurements, but they do have a number of advantages compared to respirometry. The main advantage is that calorimeters continuously measure the rate as a function of time, so the resulting ‘thermogram’ will in many cases clearly show periods of rest and periods of activity, making it easy to determine the metabolic activity at rest.
Materials and methods
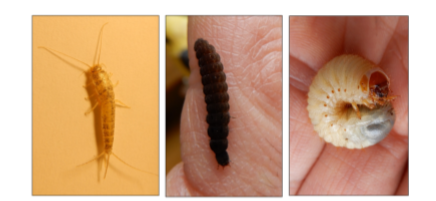
Results from three different insects (Fig. 1) are presented in this application note:
- Long-tailed silverfish (Ctenolepisma longicaudata) (length 18 mm, mass 60 mg) measured at 20 °C. Measurement was made with the insect in a plastic vial. Empty reference stack.
- Larvae of a soldier beetle (family Cantharidae) (length 15 mm; mass 60 mg) measured at 20 °C.
- 3. Four larvae of the common cockchafer (Melolontha melolontha) (length 35 mm, mass 1.52-1.76 g) measured individually at 10 °C.
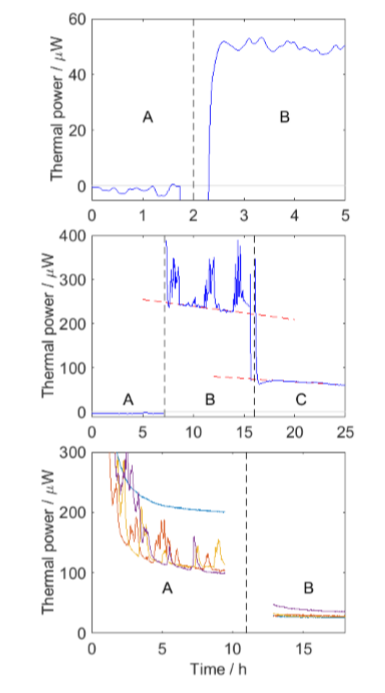
In all three cases baseline measurements were performed. This is important as the measured thermal powers are rather low. The three measurements were made in slightly different ways, with stages marked A, B and C, as seen in Fig. 2:
-
A: Baseline empty vial.
B: Vial with insect. -
A: Baseline empty vial.
B: Soil and insect. C. Only soil. -
A: Soil and insect.
B: Only soil
Soil was used in measurements 2 and 3 as both soldier beetle larvae and cockchafer larvae live in soil. It is important to keep the animals under conditions resembles what they are used to. This can in some cases be difficult, for example with flying insects or with social insects that are constantly active, trying to return to their colony [2].
Results and discussion
Figure 2 shows the results, from which it in all cases is possible to calculate SMR, although in slightly different ways.
This animal is quite relaxed with
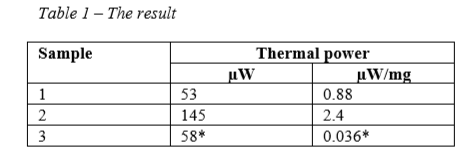
1. Long-tailed silverfishLong tailed silverfish are found in warm places indoors in large parts of the world. The present measurement was made animal that had been kept at about 22 °C for several months. Its transfer to an empty vial does not seem to have give rise to stress as the animal was resting for the duration of the measurement (cf. Fig. 2B-C with activity periods) The SMR was found as the difference between the results from part B and part A (see Table 1).
2. Soldier beetle larvae
In this measurement a standard baseline was first run (A), then soil and the insect was added (B); finally the insect was removed and only the soil was measured (C). The soil was used to create good conditions for the larvae, but as soil has significant microbial activity, the thermal power from the soil had to be measured and used as a baseline above which the insect metabolism was found. From the results it is clear that periods of rest interleave periods of activity with higher thermal power. It is easy to construct a linear curve fit to the resting periods and compare this with a linear regression of the soil results, to find the SMR as the difference between these lines.
3. Cockchafer larvae
Here, measurements on four larvae were made simultaneously and it was found that one larvae had a quite different ‘thermogram’, with higher heat production, but not activity periods. The reason for this is not known. Also in this measurement is it easy to see the resting periods, and find the difference between the soil+insect (A) and soil (B) measurements.
Notes on the calorimetric measurement
Standard metabolic rate (SMR) measurements It is not trivial to measure SMR [2] and one problem is that it is difficult to know if the animal was at rest during a respirometry measurement or not [4]. Researchers have tried to solve this issue, for example by using cameras to record activity periods, but it seems that isothermal calorimetry is a simpler way, as it is easy to pick out activity periods (Fig. 2BC). Conditions for animals during measurement It is clear that many animals do not have their natural behavior when they are measured on in respirometers or calorimeters. However, it is possible to try to make the environment in, e.g., a calorimetric vial as good as possible, for example by using soil in the vial for soil living insects. Generally, the following points could be considered:- - The size of the animal in relation to the size of the vial.
- - The activity and activity modes of the animal.
- - The texture of the inside of the vial.
- - If the round shape of normal vial is a problem (could induce circular motion).
- - The oxygen and carbon dioxide levels during a measurement.
References
-
Sibly, R.M., J.H. Brown, and A. Kodric-Brown, eds. Metabolic ecology: a scaling approach. 2012, WileyBlackwell.
-
Waters, J.S. and J.F. Harrison, Insect metabolic rates, in Metabolic ecology - a scaling approach, R.M. Sibly, J.H. Brown, and A. Kodric-Brown, Editors. 2012, WileyBlackwell. p. 198-211.
-
Wadsö, L. and L.D. Hansen, Calorespirometry of terrestrial organisms and ecosystems. Methods, 2015. 76(Online 28 October 2014): p. 11-19.
-
DeVries, Z.C. and A.G. Appel, Standard metabolic rates of Lepisma saccharina and Thermobia domestica: Effects of temperature and mass. J. Insect Physiol., 2013. 59: p. 638645.
