Approximation of optimum SO3 in hydraulic cement using Heat of Hydration
Natalya Shanahan & Abla Zayed, University of Southern Florida, Paul Sandberg, Calmetrix
Application Note AN-C05
Instruments to which this note applies: I-Cal 2000 HPC, I-Cal 4000 HPC, I-Cal 8000 HPC, ICal 4000, I-Cal 8000
Target use: Quality Control at the Cement plant and the concrete producer level. Concrete mix design
Introduction
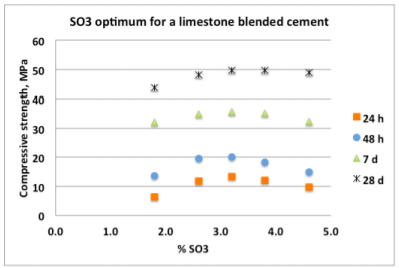
Sulfate is added to Portland Cement to control the early aluminate reaction during cement hydration. Most standards prescribe sulfate optimization at room temperature using standard compressive strength tests to determine which sulfate addition level (expressed as % SO3 by weight of cement) gives the highest compressive strength, usually after 24 hours of moist curing. Figure 1 shows a typical relationship between compressive strength and sulfate addition for a limestone-blended cement at different curing ages. While the optimum SO3 is known to vary with the curing age – it is typically higher at later ages – the value at 24 – 48 h is most widely used in the quality control of cement production.
Advantage of isothermal calorimetry
The traditional method for compressive strength testing is costly and labor intensive, compared to isothermal calorimetry. The production of standard mortar for compressive strength testing requires not only skilled technicians, but also rather expensive equipment for production, curing and testing of mortar samples. Many cement plants are not set up to handle compressive strength testing and therefore must ship cement samples to a central laboratory for sulfate optimization, a cumbersome process. As a result, proper sulfate optimization is often overlooked. On the other hand, an isothermal calorimeter is very easy to operate and can be handled with minimum skill, and without the need for a temperature controlled laboratory since the calorimeter itself has very good built-in temperature control.
Furthermore, while compressive strength testing at room temperature can be easily performed at most properly equipped cement laboratories, isothermal calorimetry offers excellent opportunities for improved sulfate optimization at a wide range of temperatures without the need for temperature controlled curing chambers, again simply by substituting compressive strength for heat of hydration. Such testing is important, since the SO3 optimum is expected to vary with temperature. If the sulfate optimization tests are conducted without admixture, one can further simplify the procedure by testing just cement and water as in ASTM C 1702, Measurement of Heat of Hydration of Hydraulic Cementitious Materials Using Isothermal Conduction Calorimetry. A video of the test procedure is shown in the Support section of the Calmetrix website at www.calmetrix.com (Tutorial 1 - I-Cal: Cement Paste Test).
Examples of sulfate optimization data for industrial cements
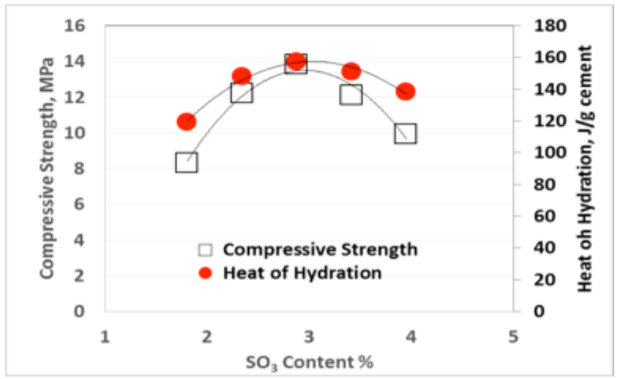
Three different hydraulic cements were tested for optimum SO3 after 24 hours moist curing using compressive strength, as per ASTM C109. Parallel tests for optimum SO3 using heat of hydration were performed using a large cell (125 ml) Calmetrix I-Cal 8000 isothermal calorimeter. The same mortar as used for compressive strength determination was tested for heat of hydration following ASTM C1702 with the following exceptions: i) mortar was used instead of cement paste, ii) the initial exotherm was excluded up until the end of the dormant period, (B) (shown in Figure 2). The broad exotherm (C) denotes the main strength-giving cement hydration peak.
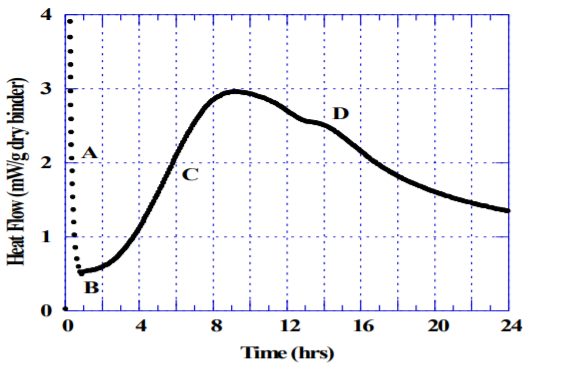
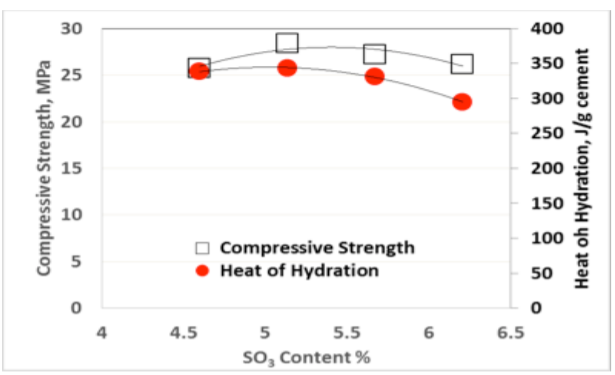
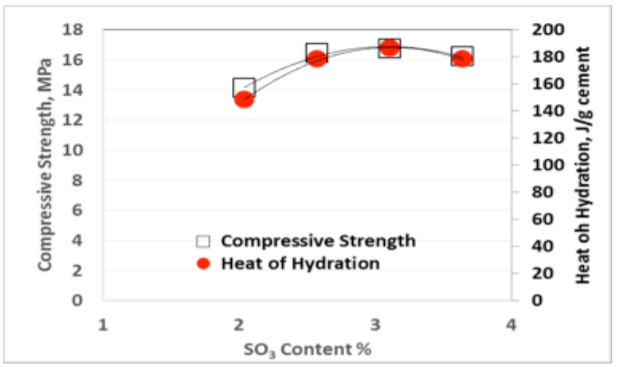
The so-called “sulfate depletion” peak (D) used by Lerch [1] is often difficult to visualize for blended cements or Portland cements low in C3A. Figures 3-5 show the results for heat of hydration and compressive strength obtained with different SO3 additions per ASTM C563, as well as the calculated SO3 optimum for each cement per ASTM C563 using compressive strength as well as heat of hydration (non-standard).
Discussion
As can be seen from Figures 3-5, there is an excellent correlation between the optimum SO3 content determined using compressive strength and heat of hydration methods, as originally published by Lerch in 1946. Similar results have been obtained for two and three days Heat of Hydration and compressive strength, respectively.
While it is easy to visually detect the optimum SO3 as the mixture with the highest Heat of hydration from a series of tests with a range of different SO3 contents as shown in Figures 3-5, it appears that one can readily use the formula in ASTM C563 by simply substituting compressive strength for Heat of Hydration.
Note that all the caveats mentioned in ASTM C563 would also apply when using Heat of Hydration in lieu of compressive strength. That is, the obtained optimum SO3 is only an indication and is expected to vary with sample type (paste vs. mortar vs. concrete), water/cement ratio, curing temperature, test age, use of admixture, use of supplementary cementitious materials, type of sulfate used, whether the SO3 is added inter-ground or not, etc. While ASTM C563 does not outline how to test for the effect of these on the SO3 optimum, it is very easy to perform such tests using isothermal calorimetry – simply by changing the test temperature, mixture design, sample type (paste, mortar or concrete). Reminder: as a rule of thumb, one should not use cement paste when testing for the effect of admixtures, as retarding effects often seen in cement paste may not be representative for concrete.
Test Protocol – Heat of Hydration of cement paste as per ASTM C1702
1. Set the calorimeter at the desired test temperature and wait for at least 16 hours for the calorimeter to stabilize.
2. Select a parent industrial or laboratory cement or clinker sample with less than optimum sulfate.
3. Weigh 50.0 g cement in each sample vial with incrementally higher contents of the sulfate source of interest in the cement. For example replace 0, 1.06%, 2.12% of cement for calcium sulfate as per ASTM C563. Optionally use higher levels of cement substitution to increase the number of data points for the SO3 optimum curve.
4. Weigh out 25 g of mix water in separate sample vials, seal them with their lids and place them in the corresponding calorimetry cells. Start logging and wait for the heat flow to stabilize at or very close to zero, at which point the mix water has reached the desired temperature. This stabilization normally takes no more than 2 hours provided that the calorimeter has been stabilized in step #1.
5. Stop logging data, configure each cell for cement paste testing.
6. For each cell remove the water from the calorimeter and immediately add the water to the corresponding cement sample and mix for 30 s, then place the cement paste sample in the calorimeter and start logging. Continue to log data for the desired test duration.
7. Use the algorithm in ASTM C563, or use the Calmetrix I-Cal SO3 module in the CalCommander Software to calculate the approximate optimum sulfate for the cement tested.
Test Protocol – Heat of Hydration of mortar or concrete
1. Set the calorimeter at the desired test temperature and wait for at least 16 hours for the calorimeter to stabilize.
2. Select a parent industrial or laboratory cement or clinker sample with less than optimum sulfate.
3. Prepare the appropriate mass of cement for each mixture to be tested with incrementally higher contents of the sulfate source of interest in the cement. For example replace 0, 1.06%, 2.12% of cement for calcium sulfate as per ASTM C563. Optionally use higher levels of cement substitution to increase the number of data points for the SO3 optimum curve.
4. Configure 3 or more calorimeter cells and start logging.
5. Prepare a mortar or concrete mixture designed for the application in mind. Prepare a sample for calorimetry by removing any aggregates larger than 2 mm, if used, to ensure a uniform cement content in the sample for calorimetry.
6. For each cell enter the correct mix time and continue to log for the desired test period.
7. Remove the Heat of Hydration data recorded prior to the end of the dormant period (Figure 2). Use the algorithm in ASTM C563, or use the I-Cal SO3 module in the CalCommander Software by Calmetrix, to calculate the approximate optimum sulfate for the cement tested.
References
• W. Lerch, The Influence of Gypsum on the Hydration and Properties of Portland Cement Pastes, Research Laboratory of the Portland Cement Association, Chicago, IL, 1946.
• ASTM Standard C563-13, Standard Test Method for Approximation of Optimum SO3 in Hydraulic Cement Using Compressive Strength, ASTM International, West Conshohocken, Pa., 2012.
• ASTM Standard C1702-13, Standard Test Method for Measurement of Heat of Hydration of Hydraulic Cementitious Materials Using Isothermal Conduction Calorimetry, ASTM International, West Conshohocken, Pa., 2012.
• ASTM Standard C1679-13, Standard Practice for Measuring Hydration Kinetics of Hydraulic Cementitious Mixtures Using Isothermal Calorimetry, ASTM International, West Conshohocken, Pa., 2012
